Reading: Advice for interpretation of learning analytics
| Site: | Loomen za stručna usavršavanja |
| Course: | Learning Analytics |
| Book: | Reading: Advice for interpretation of learning analytics |
| Printed by: | Gost (anonimni korisnik) |
| Date: | Thursday, 17 September 2026, 4:56 PM |
1. Introduction
The guidelines for interpreting learning analytics presented below are based on Divjak, B.; Žugec, P. (2022). Learning Analytics: Tips and Tricks for Teachers and Institutions. Developed as part of the Erasmus+ project Relevant Assessment and Pedagogies for Inclusive Digital Education (RAPIDE).

In the learning analytics interpretation guidelines developed within the RAPIDE project, authors B. Divjak and P. Žugec provide guidance applicable at two levels — at the level of the higher education institution and at the level of the instructor. Key guidelines and recommendations are presented below, along with real-world examples and suggestions for interpretation.
2. Higher education institutions
Institutional activities
It is necessary to develop and implement a data-driven culture and to provide regular training in data analytics so that artificial intelligence (AI) and learning analytics in particular are used in a responsible and trustworthy manner while avoiding bias. To support the development of such a culture, it is beneficial to have appropriate knowledge in the area of strategic planning, which can be acquired in the course Strategic Planning for Digital Technology Implementation. In addition, reports and materials created within learning analytics can be transformed into open educational resources, which is discussed in the course Open Education and Open Science.
For university instructors, education on the meaningful use of data analytics is essential. MOOCs and online tutorials are available as a starting point, but institutional training is needed to open up discussion.
Learning analytics should be grounded in ethical principles and in principles of equity and fairness. An institutional code of practice, or at least a set of recommendations, can be developed.
Data literacy, as well as assessment literacy, should be an integral part of the set of instructors' competencies. This can be included as part of doctoral programs for early-career academics and/or as part of continuing professional development for university teachers and staff.
Institutions should provide support to instructors in the use of learning analytics and artificial intelligence in terms of training, resources, and equipment, as well as staff support.
The most effective approach is to implement a strategic planning cycle.
Questions to be addressed at the institutional level:
- What competencies in the area of data literacy are required by stakeholders (students, instructors, developers, researchers, educational decision-makers, and employers) for the effective use of AI-enhanced learning analytics tools? Do these competencies differ among students from different disciplines and among different stakeholder groups?
- How are end users’ data literacy competencies related to their interpretation of the opportunities offered by learning analytics, their reasoning, and their decision-making related to the learning process when interacting with learning analytics tools?
- How can a data-driven culture, digital literacy, and ethical data use be fostered in the development of responsible applications of artificial intelligence in education?
- How can learning analytics and related resources be strategically planned and co-created to achieve strategic goals?
3. Higher education teachers
General recommendations
Learning analytics does not provide instructors with universal rules or generalisable results; rather, it must be interpreted within a specific educational context.
At least basic learning analytics functionalities are available in various e-learning tools and learning management systems (LMSs). Check the analytics available there, but do not interpret them without first consulting the documentation and discussing potential advantages and limitations with colleagues.
Learning analytics is always biased to some extent; therefore, instructors should be aware of their own goals as well as the limitations of a particular data analysis.
Be aware that learning analytics can both motivate and demotivate students to learn; therefore, pay attention to the types of analyses and feedback that may be more beneficial for your students’ learning.
Questions instructors should ask:
Why do you need learning analytics?
Some possible answers:
-
- monitoring or evaluating my teaching and my students’ learning
- evaluating course and learning design
- providing feedback to students to improve their learning
- evaluating the usefulness of and improving educational materials
- monitoring and evaluating the impact of a new pedagogical approach
- identifying early indicators of success or failure
- adapting teaching to students’ specific needs
Based on the answers, you select the approach, metrics, data sources, learning analytics method, and level of dissemination, as analysed below:
To summarize your thoughts when planning activities related to the application of learning analytics, you can use this table:
Why learning analytics? |
Where/which data? |
Which methods? |
With whom do I share? |
What impact do I expect? |
What training/support do I need as an instructor? |
| Students Course Higher education institution |
|||||
3.1. Examples with suggestions for interpretation
Example 1.
Learning analytics on types of learning and teaching activities obtained by combining a learning design tool (BDP) and an LMS (Moodle)
We can ask ourselves the following questions:
- When are students active and engaged?
- Do students in our course study only for exams?
- Do students have enough time to complete all planned activities?
What can we learn from the learning analytics available in the BDP tool and in Moodle?
Figure 1: Student workload (BDP) – Figure 2: Student and instructor activity (Moodle)
As expected, student activity and engagement vary throughout the semester. Fluctuations are visible and can be linked to summative assessment. Activity analysis shows when students are active and engaged. It is evident that activity increases before exams, allowing us to conclude that students in our course study primarily for exams. During these periods, peaks in activity and material usage are observed, while a drop in engagement is visible after exams.
During the rest of the semester, students use learning materials and formative assessment tools, which are visible in the chart below. Smaller increases in activity also occur in the part of the course where a flipped classroom approach is applied.
3.2. Examples with suggestions for interpretation
Example 2.
3.3. Examples with suggestions for interpretation
Example 3.
Evaluation of learning materials
If you want to identify learning materials in a course that need improvement, you can use LMS statistics related to the use of online materials (videos, textual materials, applications, etc.), student feedback, and completion rates. Based on activity analysis, you can see whether students work more with short video lectures (5–15 minutes), full lecture recordings (45 minutes), or reading materials. However, this is not the only indicator of the usability or quality of materials. You can additionally ask students, through a short survey, what they prefer, why, and for what purposes. The results can be linked with student clustering and used to analyse which materials are used and with what level of success. Based on this, recommendations can be designed for all students, and instructors can use the feedback to optimise their workload and create more meaningful learning materials. However, it should be kept in mind that not all students have the same needs or learning habits, and that a “one-size-fits-all” approach is not appropriate.
In addition, learning analytics can link the use of learning materials with assessment. For example, students may consistently fail a test because they skip a particular resource (a video, application, exercise, or book chapter). An instructor can respond to this challenge by restricting access to a quiz until the student has viewed the relevant learning resource.
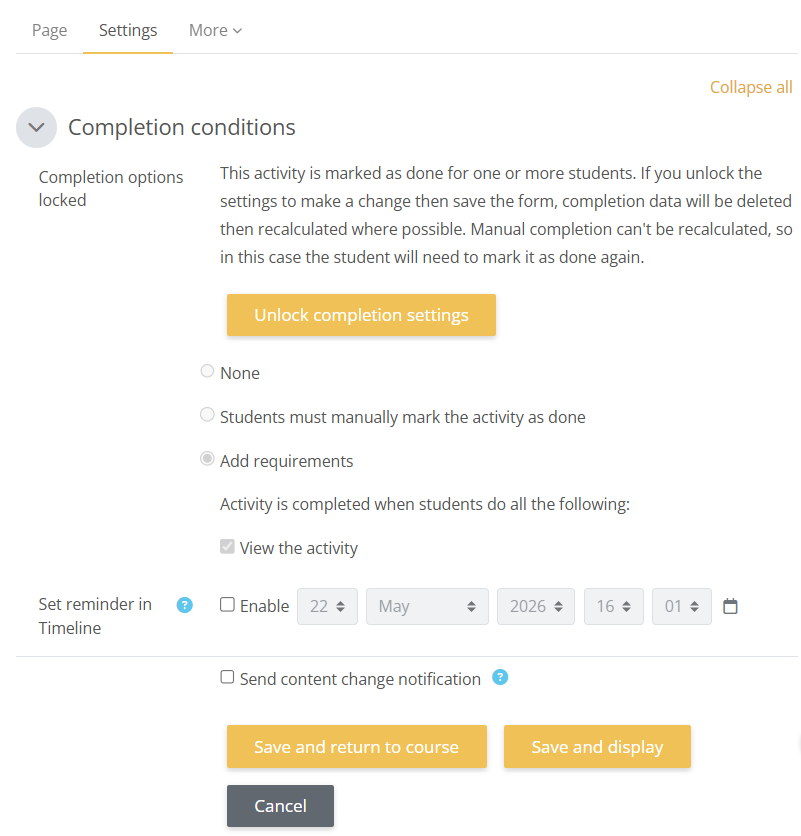
Figure 4: Functions in the Loomen LMS within activity settings: Completion conditions
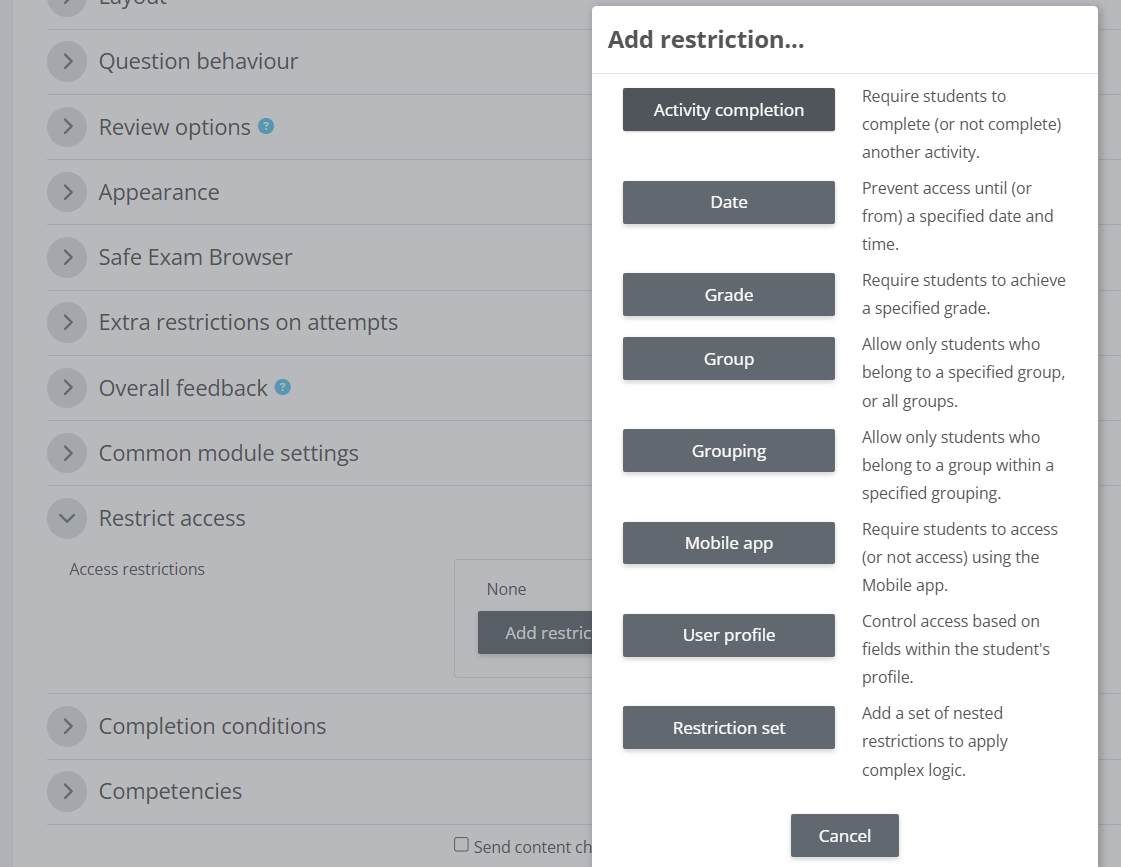
Figure 5: Functions in the Loomen LMS within activity settings: Restrict access
3.4. Examples with suggestions for interpretation
Example 4.
A quick look at learning analytics before preparing a lecture or other learning and teaching activities
Imagine that you are an instructor using a flipped classroom approach and that you have given students a preparatory task before class. You are now planning the lecture. When designing the lecture, you can review some simple learning analytics available in the LMS, such as student activity and engagement with materials, results of a pre-quiz on basic concepts related to the topic, and questions that students have posted in the discussion forum.
4. Questions for self-assessment and reflection
· How can instructors use learning analytics to improve course design and learning materials? Reflect on examples from your own practice and context.
What competencies and types of support do instructors need for the responsible and effective use of learning analytics? Relate your answer to your own experience.
Background Colour
Font Face
Font Size
Text Colour
Font Kerning
Image Visibility
Letter Spacing
Line Height
Link Highlight
Paragraph Width
Text Alignment