Assessment of the Implementation (Orchestration) of Learning Design for a Targeted Group of Students
| Site: | Loomen za stručna usavršavanja |
| Course: | Learning Design |
| Book: | Assessment of the Implementation (Orchestration) of Learning Design for a Targeted Group of Students |
| Printed by: | Gost (anonimni korisnik) |
| Date: | Thursday, 17 September 2026, 9:36 AM |
Table of contents
- 1. Overview of Key Concepts and Evaluation Activities
- 2. Assessment in Education and Learning Analytics
- 3. Case Study 1
- 4. Task
- 5. Additional literature
- 6. Case Study 2
- 7. Task
- 8. Additional literature
- 9. Case Study 3
- 10. Task
- 11. Questions and Suggestions for Reflection
- 12. General literature
- 13. Additional literature
1. Overview of Key Concepts and Evaluation Activities
Successful implementation of learning design involves more than mere technical execution – it includes the thoughtful orchestration of all teaching activities, resources, and interactions, tailored to a specific group of students. Evaluation of implementation allows us to examine the extent to which the learning design has been realized in a real teaching context and what impact it has had on student learning.
Learning design may have been developed using different models and supported by suitable learning design tools. Particularly prominent models include: ABC, BDP, and OULDI.
Subsequently, this design was (automatically) transferred into the learning management system (LMS) used by your higher education institution, most commonly a version of Moodle. The initial structure was then enriched with learning and assessment materials, thereby preparing the course for students.
During the implementation phase of the learning design, the suitability of the design for the targeted group of students enrolled in the course is monitored. Student progress is tracked using learning analytics, which is based on the collection of data during the learning and teaching process, its analysis, and the presentation of results to teachers and students. Whenever possible, the presentation of results should be accompanied by an appropriate interpretation of learning analytics, and adequate training for teachers and students should be ensured.
It should be noted that not all data about student learning activities are available as digital traces within digital systems. However, systems used by higher education institutions provide highly valuable data, the analysis of which can yield important insights into how students learn and how teachers teach. In some cases, certain analyses are automated within the systems, but more sophisticated analyses and insights require knowledge of learning analytics (such training is also available within CARNET’s professional development courses under the title: Learning Analytics). This latter aspect is part of the process through which evaluations are made accessible to those who did not directly produce them but who nevertheless need to understand, at least in principle, all stages of the evaluation process.
Such analyses and insights form the basis for decision-making at the level of individual courses, activities, and more broadly at the level of higher education institutions or even the education system as a whole. Decisions are made by students, teachers, and responsible stakeholders at different levels of governance.
In this material, we will focus on learning analytics that support students and teachers, and for which data are automatically collected in learning design tools and learning management systems.
In the following section, three case studies on the evaluation of learning design implementation will be presented, which may influence the redesign of assessment, learning, and teaching activities, or the provision of feedback to students.
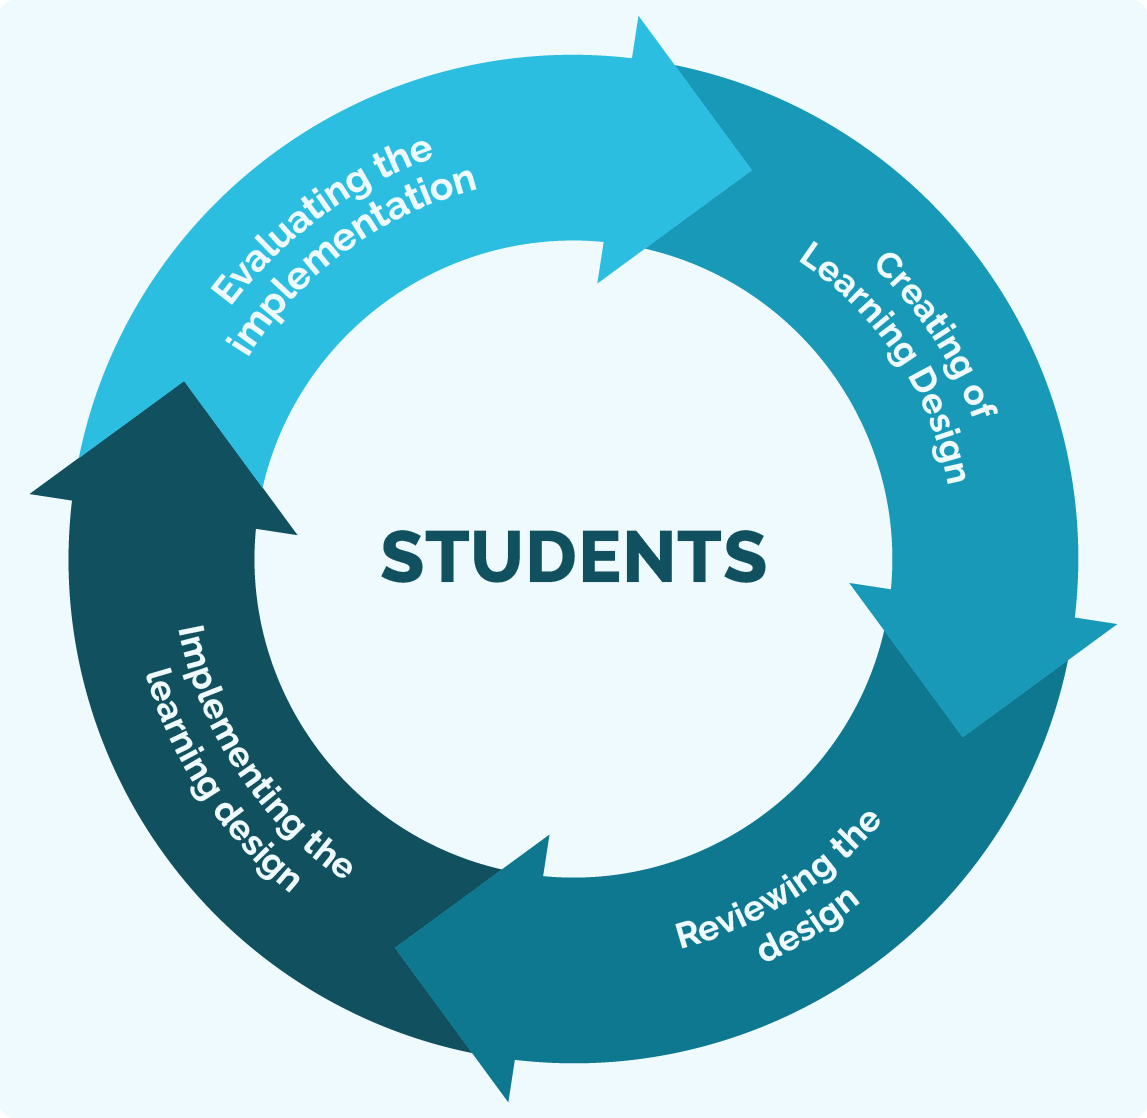
Figure 13. Learning Design Cycle
2. Assessment in Education and Learning Analytics
A frequently used general definition provided by Scriven (1991), later adopted by the American Evaluation Association (2014), states: Assessment is a systematic process for determining merit, worth, importance, or significance.
In education, assessment is often understood as applied research (assessment is applied research) (e.g., Rallis, 2014), since assessments are frequently conducted as action research by teachers themselves. However, as methods of data collection and analysis become increasingly complex, this is no longer the case for most educators.
An important aspect of assessment emphasized here is that assessment serves as a basis for decision-making. In our context, decision-makers include students, teachers, programme leaders, deans, rectors, ministers, and other stakeholders.
More on assessment theory can be found in Wanzer, D. L. (2020).
Learning analytics does not replace pedagogical reflection; rather, it complements it by providing objective insights into how students engage with content, participate in activities, and achieve learning outcomes. Such insights can be crucial:
- for identifying vulnerable groups of students
- for refining the design of learning activities and materials
- for adapting assessment practices
- for improving student support.
For effective assessment of learning design implementation, it is essential to integrate contextual data (target student group, teaching approach, available resources), system data (LMS, learning design, and assessment tools), and feedback from participants (students and teachers).
3. Case Study 1
1. Course: Introduction to Statistics – Adapting Pace and Learning Materials
Context: First year of an undergraduate university programme; a compulsory course for approximately n = 400 students enrolled in a social sciences programme. For many students, “Introduction to Statistics” represents their first encounter with a quantitative subject. Two midterm exams have already been conducted as part of summative assessment, and the third and final midterm exam is scheduled to take place within the next two weeks.
In the previous academic year, the course pass rate was 55%, and no changes were made to the course design prior to its delivery in the current year.
Evaluation: Data from the LMS are analysed, including login frequency, time spent on quizzes, and weekly quiz results.
Results: The analysis revealed that 40% of students are lagging behind in completing weekly tasks or do not complete them at all. The level of student activity over the past three months is illustrated through a Moodle-based visualisation of activity throughout the semester.
The following graph presents student workload in the learning design, broken down by types of learning and teaching activities.
4. Task
What is your assessment of students’ expected performance in the third midterm?
What instructor intervention would you recommend at this point for this group of students?
What changes to the learning design would you recommend for the next academic year to improve student outcomes?
What would you do differently if you had had these data at the beginning of the semester? How would you use data continuously to improve teaching?
5. Additional literature
Divjak, B., Svetec, B., & Horvat, D. (2024). How can valid and reliable automatic formative assessment predict the acquisition of learning outcomes? Journal of Computer Assisted Learning, 1–17.
Taras, M. (2010). Assessment – summative and formative – some theoretical reflections. British Journal of Educational Studies, 53(4), 466–478.
6. Case Study 2
2. Course: Artificial Intelligence – Theory and Application – Adjustment of Assessment Methods
Context: The course is delivered at the graduate level of a technical faculty and is attended by 120 students. The student pass rate in the previous year was 85%, and no significant changes were made to the learning design before delivering the course in the current academic year. In addition to theoretical knowledge, the course requires students to demonstrate the ability to apply theory to solving practical problems in the technical domain, through teamwork.
Evaluation: Data are analysed from the LMS (login frequency, time spent in the wiki, results of midterms, and the project assignment) as well as from the BDP tool.
Results: The assessment structure was designed using the BDP tool.
The following graph shows the planned workload by types of teaching and learning activities (in the BDP tool) for the learning outcome related to applying artificial intelligence to solving real-world problems. At the end, the results of the midterm assessment are presented based on Moodle statistics.
The problem-based task was completed by students working in teams of four. They were required to solve the task using the wiki in Moodle and then submit their solution to the Workshop activity, where the project work was assessed by instructors (two instructors taught the course) and by peers, according to predefined criteria.
The average project score was 18/27, and the average score students received for the quality of their peer assessment in the Workshop (strict grading) was 1.5/3.
7. Task
What is your assessment of students’ overall performance in the course?
What instructor intervention would you recommend for this group of students? Take into account the development of artificial intelligence and its availability to students.
What changes to the learning design would you recommend for the next academic year in order to improve student outcomes related to the learning outcome focused on applying artificial intelligence to solving real-world problems?
8. Additional literature
Biggs, J., & Tang, C. (2011). Teaching for quality learning at university (4th ed.). McGraw-Hill Education.
Divjak, B., Svetec, B., Horvat, D., & Kadoić, N. (2023). Assessment validity and learning analytics as prerequisites for ensuring student-centred learning design. British Journal of Educational Technology, 54, 313–334.
9. Case Study 3
3. Course: Didactics – Learning Analytics–Based Feedback from Forum Activity
Context: In this pedagogical course at the graduate level for future teachers, the focus is on inquiry-based learning and reflective learning through forum discussions. The course enrols 36 students and has a high pass rate (over 90%); however, the instructors (three in total) are not satisfied with the level of interaction in the course, both in the online environment and in face-to-face classroom settings.
Evaluation: Course design data from the BDP tool were analysed, together with forum analytics (number of posts per student, depth of discussion measured by the number of replies, and content analysed both automatically and manually).
Results: Uneven engagement was observed: 25% of students did not post more than one contribution per topic. From a thematic perspective, discussions often remained superficial.
In the BDP tool, the following analytics of student workload by types of teaching and learning activities were provided: the highest workload was planned for research activities, followed by production activities.
The following graph presents Moodle activity data for one academic year, showing forum discussions by topic. The final image presents an example of responses from a student survey conducted at the end of the semester, completed by 20 students.
In open-ended survey responses, students reported that there were too many essay-type assignments, that the student workload was significantly higher than expected, and that feedback to students should have been provided within two days.
10. Task
What is your assessment of student success in the course?
What instructor intervention would you recommend for this group of students? Take into account the specific context and characteristics of this student group.
What changes to the learning design would you recommend for the next academic year to encourage more active student participation in discussions? Link your proposal to relevant literature and learning theory.
Participants should first answer these questions individually and record their responses, as they will be useful for the continuation of work in the teams that were formed earlier.
11. Questions and Suggestions for Reflection
Self-assessment questions
-
What is the main difference between evaluation and research in an educational context, according to Scriven (1991) and Rallis (2014)?
-
What are the three main groups of data used in the evaluation of learning design implementation?
-
How can learning analytics support instructors and students during course implementation?
-
What are the main goals of evaluating learning design implementation in relation to learning outcomes and pedagogical effectiveness?
-
In which situations can evaluation lead to the redesign of activities, assessment, or feedback to students?
Reflection questions
-
How would you monitor the success of learning design implementation in your course, and which indicators (quantitative and qualitative) would you use?
-
If, during the semester, you noticed that 40% of students were falling behind in activities (as in the “Introduction to Statistics” case study), which interventions would you implement and why?
-
Based on the case study “Artificial Intelligence – Theory and Application,” what would you change in the assessment structure to better support the application of knowledge and teamwork?
-
How could forum analytics, as in the “Didactics” case, help foster deeper discussions and reflective learning?
-
What steps would you take to involve students and colleagues in the course evaluation process so that evaluation becomes a shared tool for learning and quality improvement?
12. General literature
American Evaluation Association. (2014). What is evaluation?
Rallis, S. F. (2014). When and how qualitative methods provide credible and actionable evidence: Reasoning with rigor, probity, and transparency. In Credible and actionable evidence: The foundation for rigorous and influential evaluations (2nd ed., pp. 137–156). SAGE Publications.
Scriven, M. (1991). Evaluation thesaurus (4th ed.). SAGE.
Wanzer, D. L. (2021). What is evaluation?: Perspectives of how evaluation differs (or not) from research American Journal of Evaluation, 42(1), 28–46.
For those who want to learn more
Participants are encouraged to explore additional examples of learning analytics and case studies in open-access articles published in the proceedings of leading international conferences in this field (CORE rank A).
| Conference | Rank | Focus | Website | Proceedings |
|---|---|---|---|---|
| LAK (Learning Analytics & Knowledge) | A | Learning analytics, design analytics | LAK – SoLAR | ACM LAK Proceedings |
| AIED (Artificial Intelligence in Education) | A | AI in education, ITS, adaptive systems | IAIED | Springer AIED Series |
| EDM (Educational Data Mining) | A | Educational data mining, learning analytics | EDM Conference | EDM Proceedings Archive |
| ICLS (International Conference on Learning Sciences) | A | Learning design, learning sciences | ISLS – ICLS | ISLS Proceedings |
| EC-TEL (European Conference on Technology Enhanced Learning) | A/B | TEL, AI in education, learning design | EC-TEL | Springer EC-TEL Series |
| CSCL (Computer Supported Collaborative Learning) | A | Collaborative learning, design for interaction | ISLS – CSCL | CSCL Proceedings |
| ICALT (IEEE International Conference on Advanced Learning Technologies) | B | Educational technologies, AI | IEEE ICALT | IEEE Xplore – ICALT |
13. Additional literature
Brookfield, S. D., & Preskill, S. (2016). The discussion book: 50 great ways to get people talking. Jossey-Bass.
Vygotsky, L. S. (1978). Mind in society: The development of higher psychological processes (M. Cole, V. John-Steiner, S. Scribner, & E. Souberman, Eds. & Trans.). Harvard University Press.
Background Colour
Font Face
Font Size
Text Colour
Font Kerning
Image Visibility
Letter Spacing
Line Height
Link Highlight
Paragraph Width
Text Alignment