5. SAMR model
SAMR model
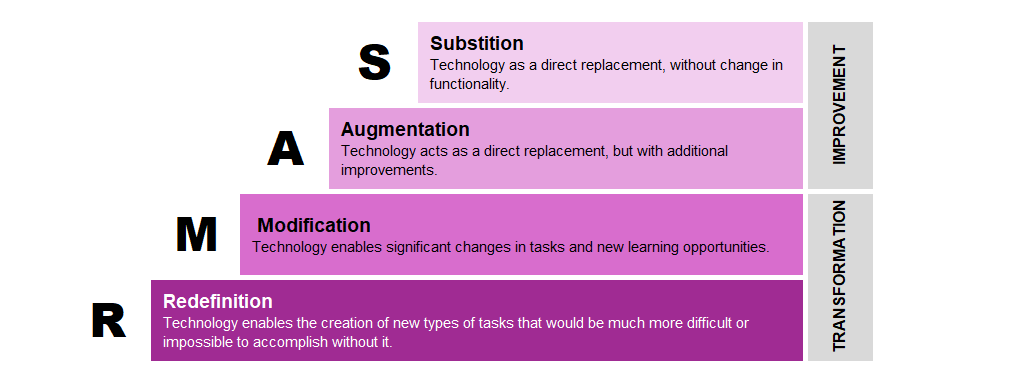
The SAMR model was developed in 2010 by Ruben Puentedura and consists of four levels of online learning, roughly ordered according to their transformative power. SAMR is a reflection tool that can help teachers think about how the integration of digital technology supports learning in specific educational contexts/situations and activities. The abbreviation SAMR stands for substitution, augmentation, modification, and redefinition.
The individual phases of the model are described below.
In the substitution phase, technology is used to solve a task that could equally well be done without the use of technology, for example, students solve a printed task on paper or use a digital source such as a book.
In the augmentation phase, technology is used for a task that would otherwise take much longer or be more difficult (complex) if students were to complete it without the use of technology, e.g., students complete an online exam with closed questions that are automatically graded and scored by a distance learning system. Students edit text on a computer, adding images, sound, or video, and the like.
The phases of substitution and augmentation represent the foundation of the transformation of the educational process, which is actually carried out in the remaining two phases: modification and redefinition.
In the modification phase, technology provides students with new learning opportunities. For example, after writing a seminar, students can record it as a short video and share it with their colleagues. They can also create an infographic or poster with interactive elements (such as video, audio, and links to other resources).
In the redefinition phase, technology provides the possibility of creating new types of tasks that would be much more difficult to achieve or impossible without the use of technology, such as recording and producing an interactive video on a topic, creating a digital book, an interactive timeline with plenty of multimedia content and links to external content for each of the points/events, and interactive maps with data collected during field research and the like.
The link above is available in Croatian only. Participants may use free AI-powered translation tools to access the provided materials.
Background Colour
Font Face
Font Size
Text Colour
Font Kerning
Image Visibility
Letter Spacing
Line Height
Link Highlight